“I love this team.”
This is a sentiment most FC Cincinnati fans feel, it is not just me. In fact it’s tens of thousands of fans that helped deliver an MLS team to the Queen City, and they are excited to pack the new gem of the city, TQL Stadium. That is how much the fans love this team.
However, even before the fans have had a chance to watch their team live from the West End stadium, concerns have started to surface from the fan base, and rightfully so. The concerns focus mainly around results, but they also focus on the style of play. Yes, the results have not been there, but it has been more the eye test that is concerning. When FCC tied Nashville, on the cover it was a good result, but watching the game it was clear that FCC was holding on for dear life. Then when the team traveled to New York and Orlando, and it completely looked flat, it is concerning.
By now most of you know I am a statistics lover, and I enjoy viewing the game and players through numbers. I also know you can’t just look at numbers and say this team is good and this team is bad. Numbers provide a strong foundation for proving results but they do not guarantee a specific result. Soccer (don’t crucify me for using this word) is a sport where luck and game state influence numbers greatly.
What does this mean?
Let’s use Nashville game as an example. FCC scored early twice. This changed the game state to where the style of play can change dramatically. In that game, FCC could afford to sit back, and Nashville was forced to attack. Once Nashville tied it up, the game state shifted, and at that point FCC did not change or was unable to effectively influence play at that point. This is the concern. I want to provide a few graphics to show why I am concerned and why the numbers do not always align, but they may not align because of the style of play by a team.
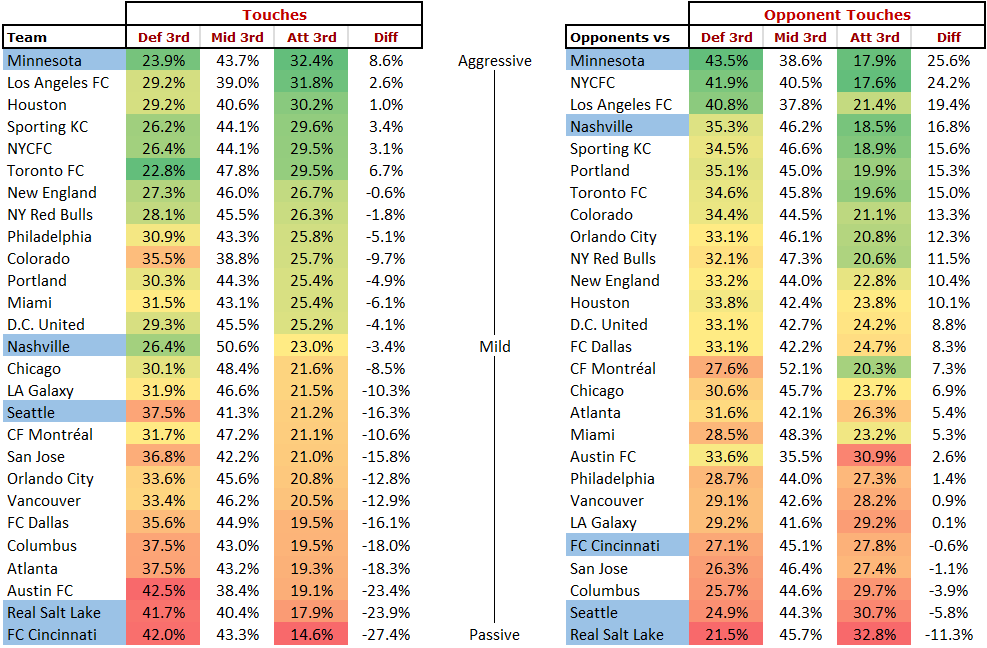
The graphic above on the left shows the percentage of touches by a team and what part of the field they occur in. Using the chart, you can see Minnesota United has 32% of its touches occurring in the attacking third of the field and only 24% on its defensive third, while FCC only has 14% of its touches occurring in the attacking third and 42% on its defensive third. The result for FCC is they finish dead last when you take the difference of attacking third compared to defensive third, -27% is the result.
The graphic on the right is the opposite. Where do opposing teams touch the ball when playing against a team? Opponents are touching the ball in the attacking third against Minnesota only 18% of the time. But those same opponents are touching it on their defensive third 43%. When looking at FCC you can see a balanced number of FCC opponents are getting a few more touches in FCC third, 27.8%, when compared to them touching the ball in their own third at 27.1%. Cincinnati is fifth from the bottom when looking at the difference of attacking third and defensive third.
I highlighted a few teams in the graphics to discuss game state and style of play and how these impact the numbers. First let’s look at Minnesota United. It led both these graphics, and yet it has not gathered a point this season. In all its games it never led and in two of the games it was losing by halftime. Minnesota’s style is to maintain possession and the fact it was pressing for a goal in all its games shows up in the above. All the teams allowed Minnesota to have the ball, and Minnesota penetrated the final third but could not finish (I will have a graphic at the end that will show this). By the numbers above I would say Minnesota will eventually break through, but it has to find the final ball. My concern is, why is it when FCC is down, it is not able to get the ball forward? The game state has changed, and FCC’s opponents don’t need to press but FCC is unable to even use the changed game state to its advantage.
Looking at Seattle’s numbers above, one would think it is a middle to lower performing team. However, Seattle has seven of nine points so far. How are they doing it? It is its style, and honestly I think its style is the one I find Jaap Stam wanting FCC to play like. Seattle is a quick counter team that punishes teams for pressing so hard. Seattle absorbs pressure, and it does it well and they get out quickly. Then it finishes with quality (Again I will show a graphic at the end that points this out.) My concern here is why can’t FCC counter quickly? If this is the style, shouldn’t it be well-prepared to defend and then spring forward on the counter. Is it talent, is it coaching?
I highlighted Nashville and Real Salt Lake because Nashville has strong numbers as well but only three points, while Real Salt Lake has weak numbers and has six of six points. Again the graphic below will help explain a little bit of this.
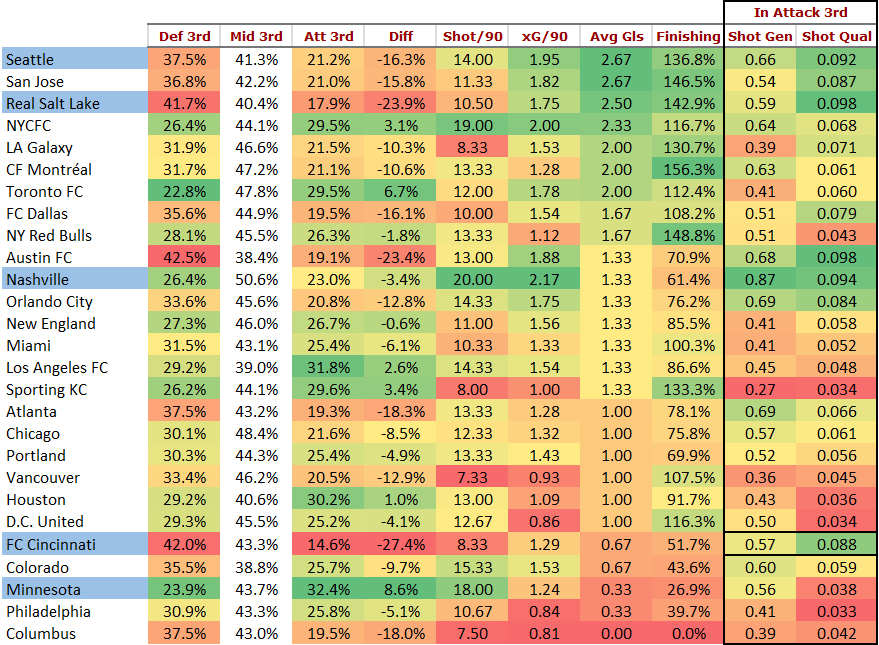
The graphic above is sorted based on goals scored per game. There is one column that really stands out on this and judges success especially at the top. It is finishing. Nashville has a solid stat line here, even if it is buoyed by the game against FCC, but its finishing (Avg Goals/xG) is sixth from the bottom. Seattle and Real Salt Lake are near the top. I do think Seattle is built in a way FCC wants to play like, and I do think Real Salt Lake may have gotten a little fortunate, but it is finishing. If FCC finished at Real Salt Lake’s rate, FCC would have five goals this season with the exact style they are playing.
There is no doubt that FCC needs to get in the attacking third more, and I don’t want to see all the negative. So here is the dash of hope I want to provide from the numbers. I wanted to see how well FCC’s offensive efficiency was when it hit the offensive third. How many shots did it get based on the amount it was in the attacking third? What was the shot quality it generated while in that zone? The last two columns answered those questions. When FCC gets into the attacking third, they generate 0.57 shots/ percent in attacking third (8.33/14.6), which is middle of the road, but the quality of the shots is 0.088, which is really strong (1.29/14.6). Yes, game state will impact these numbers, but this is a sign that when it does get there it is able to generate some chances. Now FCC just needs to get into the final third more than 14%.
No matter the concern, make no bones about it, “I love this team” and I am sure you guys do too!
Recommended for you