

credit: John Klare – John Klare Photography
There is a saying, “You can make numbers say anything you want.” That is a true statement, but I wanted to provide a mathematical process in which I graded the USL Eastern Conference and explain the results, somewhat objectively. The ultimate measure will always be the table itself and I know that.
There are a couple components that contribute to the Final Grade a team receives, the “BASE GRADE” and the “EXPECTED GRADE.” Below is a brief explanation of what those components are measuring. These grades are based only on the USL regular season.
BASE GRADE:
I think there are times that teams actually perform a little better or worse than what their standing in the table shows. I try and provide a representation of what I call the “Base Grade”, which utilizes a team’s standing in the table and also grades their offensive and defensive prowess by using goals for and against (note not goal differential). The results are below:
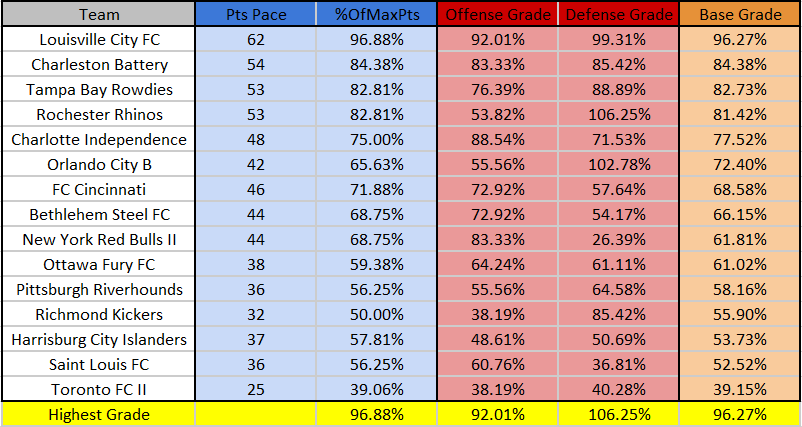
As you can tell the Base Grade is very closely tied to the standings for teams. A couple variances are Orlando and Richmond, which moved up a spot or two. Orlando’s jump comes from the team’s defensive prowess and that moved their grade higher. Richmond’s has couple factors, the Kickers were good defensively as well, but Saint Louis was one of the poorest defensive teams in the conference and that dropped them down.
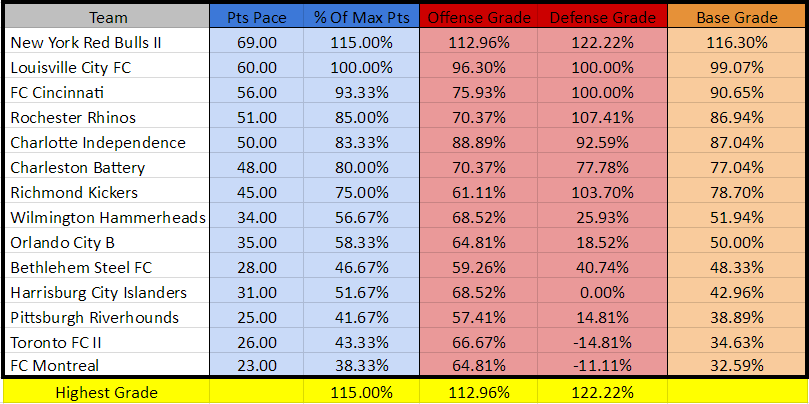
For comparison, here is what last years Base Grade Table looked like. Want to know what one of the biggest difference for FC Cincinnati between 2016 & 2017? Defense, look at the drop off in their defensive grade. What is the reason for that drop-off? The reason is not necessarily a measurable one, but a philosophical one. Also, look how dominate New York Red Bulls were in 2016.
EXPECTED GRADE:
As I stated that Base Grade is pretty straightforward and very close to the standings. But we all have preconceived thoughts of how a season is going to go for a team, called expectations. We all want our team to win it, but I think there are fans/teams that have more realistic expectations at times and maybe some that have higher expectations. My point is a team like Toronto may just want to make the playoffs and if they actually won the whole thing they would far exceed their expectations. While a team like FC Cincinnati would want to be on top of the table and win the whole thing. But how can I measure expectations?
Well, I used a subjective measuring stick, the CST preseason poll. By using the poll I came up with a formula that would calculate the number of points a team would be “Expected to score” in the season. Yes, emotions go into the poll and teams may have been placed higher/lower than what they should have been, but that is the nature of the beast. Below are the results for expected points and the grade associated with how a team did using the calculation.
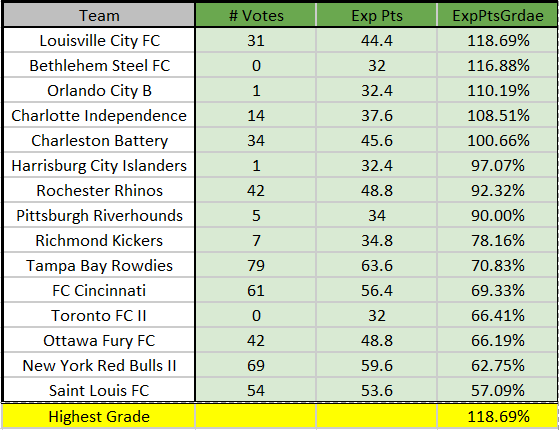
Teams that far exceeded what was calculated received scores above 100%. While teams that performed not as well, but were expected to perform better scored poorly (FC Cincinnati had 56.4 pts expected). Now, with any formula, there can be outliers and the biggest one in this component is Tampa Bay. Tampa Bay played well enough to do well on the table, but their expectations were pretty high off to start the year off. They scored poorly, this is what happens when you spend a lot of money, you are expected to perform well, which Tampa did at home but not on the road. Their road form is what really cost them on this score.
SEASON GRADE:
For a team’s final grade, I combined the Base Grade and the Expected Grade to come up with a Season Grade.
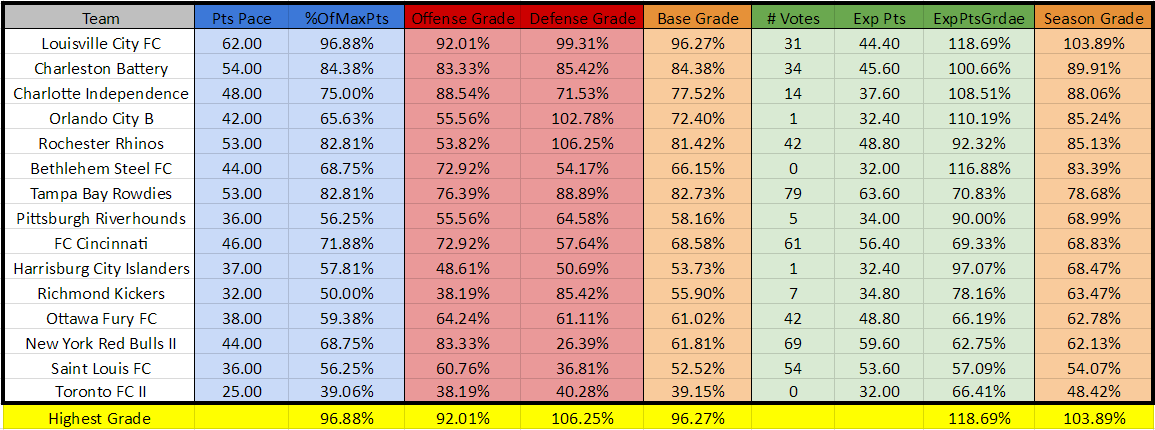
A = 90%+, B = 89%-80%, C = 79%-70%, D = 69%-60%, F = 59% or less
Orlando and Bethlehem climb further up from their table standing because their season was a success from the side of expectations. Saint Louis did poorly across the board. Louisville received the only A, while two teams failed (Saint Louis and Toronto). Our beloved FCC got a D+, remember this does not include the US Open Cup run. Their grade seems pretty fair considering where we finished and where we initially saw them finishing. Tell us what you think? Was your team scored too high/low?
WESTERN CONFERENCE
Here are the Western Conference Base Grades for the last two years, if that interest you. We did not take a poll of Western Conference teams, so we do not have an Expected score for them.
Western Conference 2017 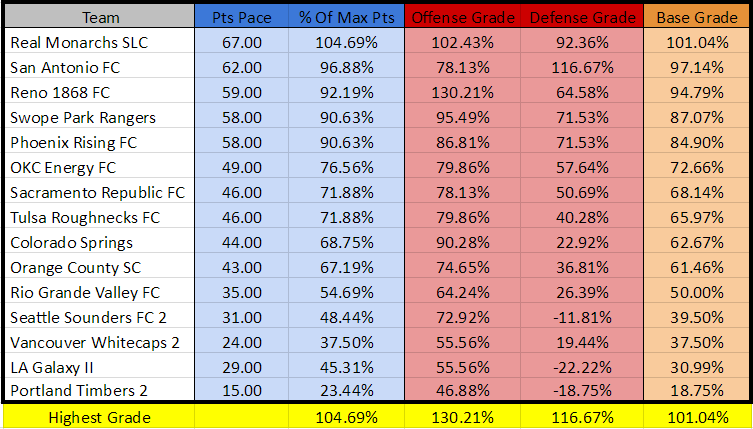
Real Monarchs had the highest grade, you can see that is derived from them being solid both offensively and defensively. While both San Antonio and Reno were the most proficient on opposite sides, offensively Reno led the league in goals while San Antonio led the league in goals against. Only Vancouver leaped another team with more points, this was due to the fact that La Galaxy II was by far the worst team defensively. Look at how similar Sacramento was to FC Cincinnati in 2017 and below you can see how similar the Republic were to FCC in 2016 as well.
Western Conference 2016 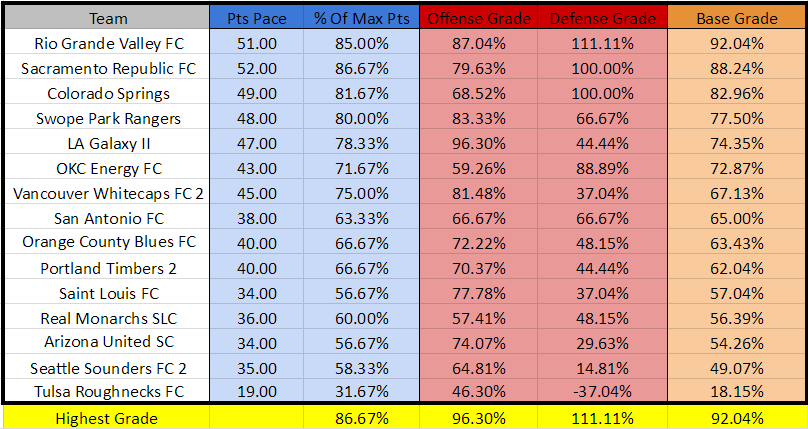
We hope you enjoyed this mathematical approach. Please share your thoughts below in the comments section!
@khoetker for @cincysoccertalk
[getsocial app=”sharing_bar”]
Recommended for you