

photo credit Jeremy Miller – @JeraldFitz88
Shots, Chances, Goals
Wayne Gretzky once said, “You miss one hundred percent of the shots you don’t take.” Now, why does that statement scare me when it comes to my beloved Orange and Blue? Because we are not taking many shots and more importantly we are not creating enough opportunities and it can be shown statistically.
I know people will say, we won both games on the road and that is all that matters. I would respond, “You are correct, but what about the future?” This piece is about the long-term projection the team is displaying on the pitch rather than just the end result of a couple games. Again, I know we won both games. The concern is what is the probability FC Cincinnati can win games playing the way they have in their opening two contests?
I have been researching different analytical approaches to the game and found a statistical measurement that is widely used across the footballing world called Expected Goals (xG). xG is a formula that projects the expected scoreline based on quantity and quality shots taken by a team in a match.
By using this measurement I can provide the likely outcome or evaluate previous games by looking at a teams shots taken. There are two different models that can be used, the shooter model (used for individuals) and the team model. Since I am comparing teams as a whole, I am going to use the Team model. I don’t want to dive too deep into the minutia formula, but I do want to explain the three main factors the model uses.
1. Where on the pitch are the teams shot taken? There are six areas defined by the model (see image) and each area has a different likelihood of scoring assigned to it.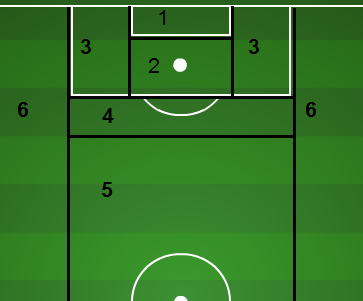
2. Are the shots taken with the head or foot? Headers have a lower likelihood of scoring.
3. Was the shot derived from a corner? Shots from corners again have a lower likelihood of scoring. More defenders in the box.
These are just three factors but there are numerous other scenarios that play into an actual goal. How many bodies between the shooter and the goal, is the ball bouncing, the condition of the field, weather, etc? But all those factors are not consistent with every shot, so they are not figured in and the statistical world avoids using them.
I broke down the first two games into three types of shots that OptaStats provides.
- Shots on Target
- Shots off Target
- Shots that were blocked
** xG maybe slightly higher due to the fact I could not account for every shot as either a header or coming from a corner
FC Cincinnati vs Charleston
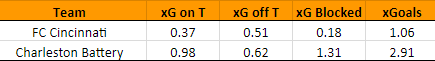
The statistical outcome based on shots should have been 3-1 for Charleston. Notice the xG for Charleston in the xG Blocked (third) column. Cincinnati had an inordinate amount of blocks in this game. The defense quelled many chances and denied more than a goal if this was an average match. If we took out the blocked shot in the game the expected score drops to 1.6 to 0.88 still in favor of Charleston, but closer to a draw.
FC Cincinnati vs Indy XI
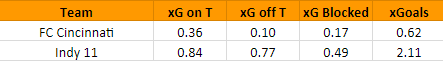
The statistical outcome line based on shots should have been 2-1 or 2-0 for Indy. The chart shows that Indy took a number of shots that were not on target. These traditionally are lower percentage chances from outside the 18. If we remove those from both teams it turns into an expected scoreline of 1-0 for Indy or a 1-1 draw. Also, two of Indy’s chances occurred on the penalty kick, if we removed that single play Indy’s xG drops significantly and the game is much closer. Still, not great for our offense, but this makes our defensive unit appear stronger.
Summation
Again, Cincinnati won both these games and on the road, that is the most important number. However, based on the statistics our boys had a little luck on their side for these two games. The opponents did not finish to their “average” ability, but the defensive unit also made a strong effort. These were two games that per the formula Cincinnati statistically should have walked away with losses.
In both these games, we scored early and may have taken our foot off the pedal, meaning we were unwilling to risk our defensive shape and that can be a reason the numbers are skewed. On the other hand, this team is one of the most talented and should be able to control the game without going into a shell and absorbing all the pressure. FC Cincinnati will need to dictate the pace of future games. The end result of having more control should allow FCC to generate more shots and limit the number of shots they concede. That is a basic principle, but one that the above numbers show they have not been able to accomplish. Statistics say the trends will need to reverse to continue the winning ways for FC Cincinnati.
Stay tuned for more statistical reviews throughout the season. While every formula is not perfect there are different ways of analyzing their play and we hope that you may find these useful. For more information on xG visit American Soccer Analysis.
@khoetker for @cincysoccertalk
Recommended for you